overview

Understanding D2T's Market Events (Crypto Trading Signals)
Profitable trading in crypto boils down to knowing the best times to buy, sell, or just wait things out.
Technical analysis (TA) is essential for getting a read on what the market is doing, how it’s changing, and where it might go next.
A trading signal is like an alarm from a technical indicator that tells you there’s a potential opportunity to make a move, either to buy or to sell.
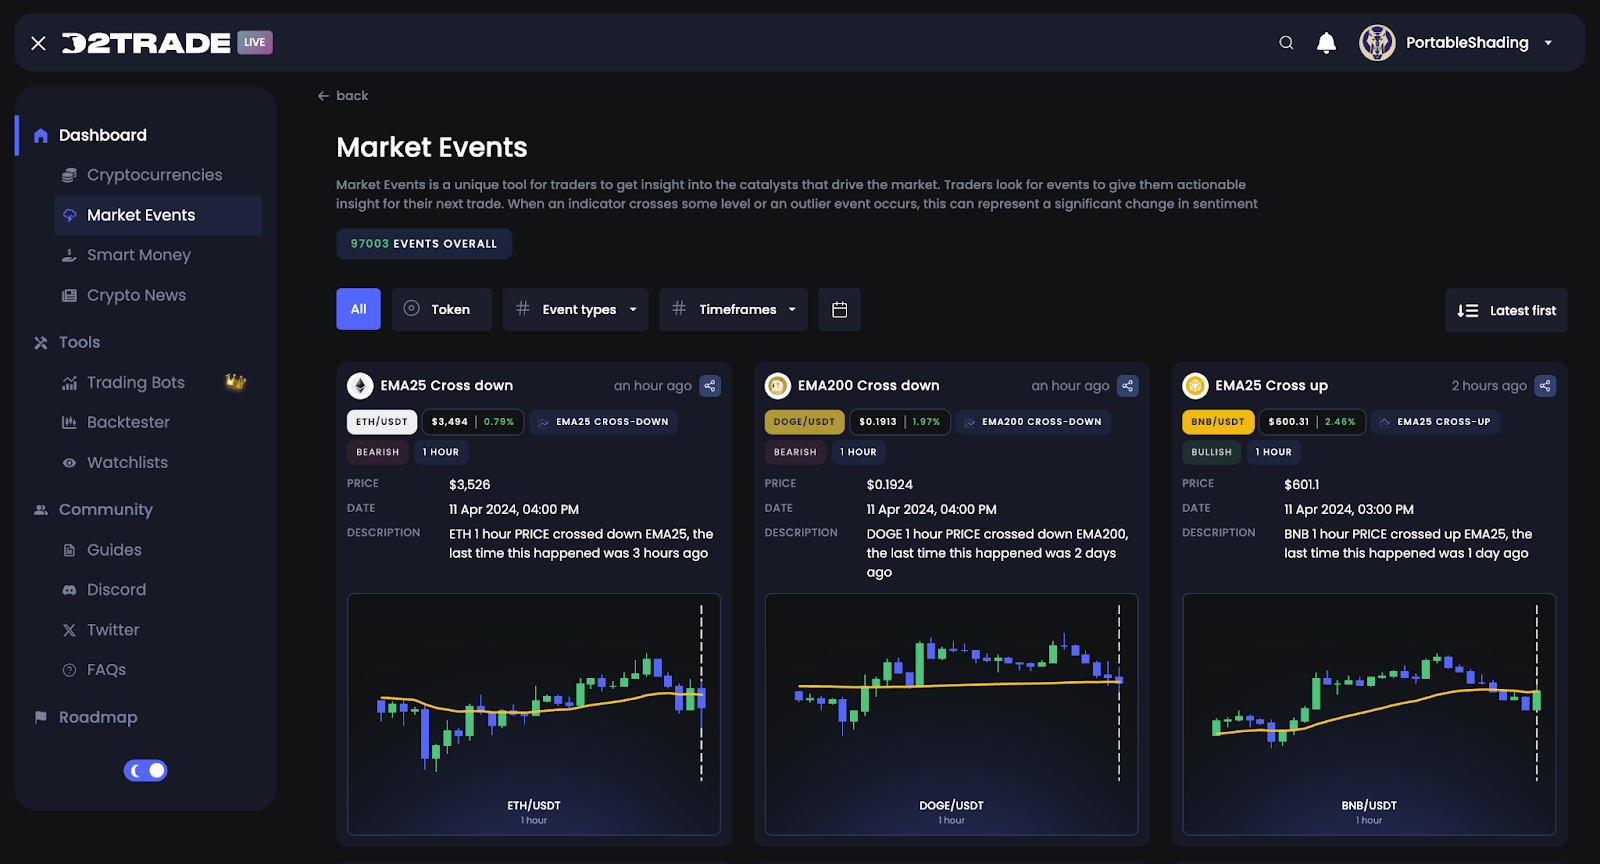
Dash 2 Trade has a whole page called Market Events dedicated to surfacing trading signals for hundreds of cryptocurrency trading pairs, giving you an eagle-eye view of the crypto market.
In this article, we will break down how each trading signal works, and what you can learn from it so you can start making better trading decisions.
A Quick Introduction to Technical Analysis
Technical analysis (TA) is the process of analyzing technical data gathered from past market activity in order to make informed predictions about future price movements.
It is one part of a three-part comprehensive approach for evaluating the potential profitability of any given asset, the other two being:
- Sentiment analysis (SA): Analyzing public attitudes toward an asset by observing news, social media, and other public forums.
- Fundamental analysis (FA): Analyzing the value of the core product or service underneath an asset by tracking fundamentals like profit, risk exposure, debt, and more.
We won’t be diving too deep into either one in this article but if you want to learn more about these topics and crypto trading in general visit the Dash 2 Trade Crypto Trading Academy!
How Does Technical Analysis Work in Practice?
In practice, those doing TA rely heavily on specialized tools that provide them with the necessary historical market data, neatly interpreted and displayed across numerous technical indicators.
What is a Technical Indicator?
A technical indicator, at its core, is always some sort of percentage, ratio, or number derived either directly from raw market data or through some mathematical expression applied to that data.
Hundreds of unique indicators can be created from the same piece of data (e.g., an asset's historical price). The difference between them is in how that data is being interpreted and/or mixed in with other data to highlight a different aspect of the market’s behavior.
Here are two examples of technical indicators so you can get an idea of the scope of what the term covers:
- Trading Volume: This is one of the simplest possible indicators. It’s just a sum of the value of all trades made over a given period. For example, if there have been ten trades (buys and/or sells) worth $10,000 each, over the past hour, that would come out to a trading volume of $100,000 for that one hour. This indicator is always a simple number—a sum.
- Money Flow Index (MFI): In contrast, the MFI uses both volume and price to show us something about the market that we can’t easily see just by looking at price and volume separately. This indicator doesn’t return a simple number, instead, it displays as a number between 0 and 100 (behind the scenes it's just a ratio between two other indicators — money inflows and outflows). How we arrive at this indicator is too complicated to explain here but there’s some math involved. The important thing is that it already exists! It’s preprogrammed into charting software (e.g., TradingView) so you don’t have to calculate it yourself. So are thousands of other indicators like it.
What Can Technical Indicators Tell Us?
In essence, indicators show us the states of (and relationships between) various pieces of historical market data. Technical analysts look at indicators to see correlations between price movement and what the indicators are showing.
For example, high trading volume after an asset's price has broken free from a ranging market is statistically more likely to lead to a sustained upward trend than when volume is low.
Note: Indicators can’t guarantee market outcomes but traders can use them to make better predictions about future market behaviour. This is the essence of technical analysis.
What is a Trading Signal?
Trading signals are what traders are looking for when they’re doing technical analysis using technical indicators (and other resources). Traders are constantly on the hunt for trading signals.
A signal isn’t something fixed. Every trader can decide for themself what states or behaviors of one or more indicators they would consider a “signal”.
For example, low volume in one market might be an entirely random and normal occurrence. At the same time, in another market, it could signal a major shift in sentiment that could lead to a significant price decrease.
That being said, over many years, through observation and experimentation, traders have discovered some indicator states and behaviors that universally occur more often in certain market conditions than others.
In other words, there are some states and behaviors of indicators that are universally understood to be high-quality, actionable trading signals.
Dash 2 Trade has packaged a number of these popular signals into its Market Events dashboard in the form of individual infographics. Now, let’s explore each one in detail!
Market Events Trading Signals Demystified
At the time of writing, Dash 2 Trade tracks dozens of indicators across hundreds of token trading pairs to generate sixteen unique signals. When discovered, each trading signal is displayed as an information card on the dashboard. We call these Events.
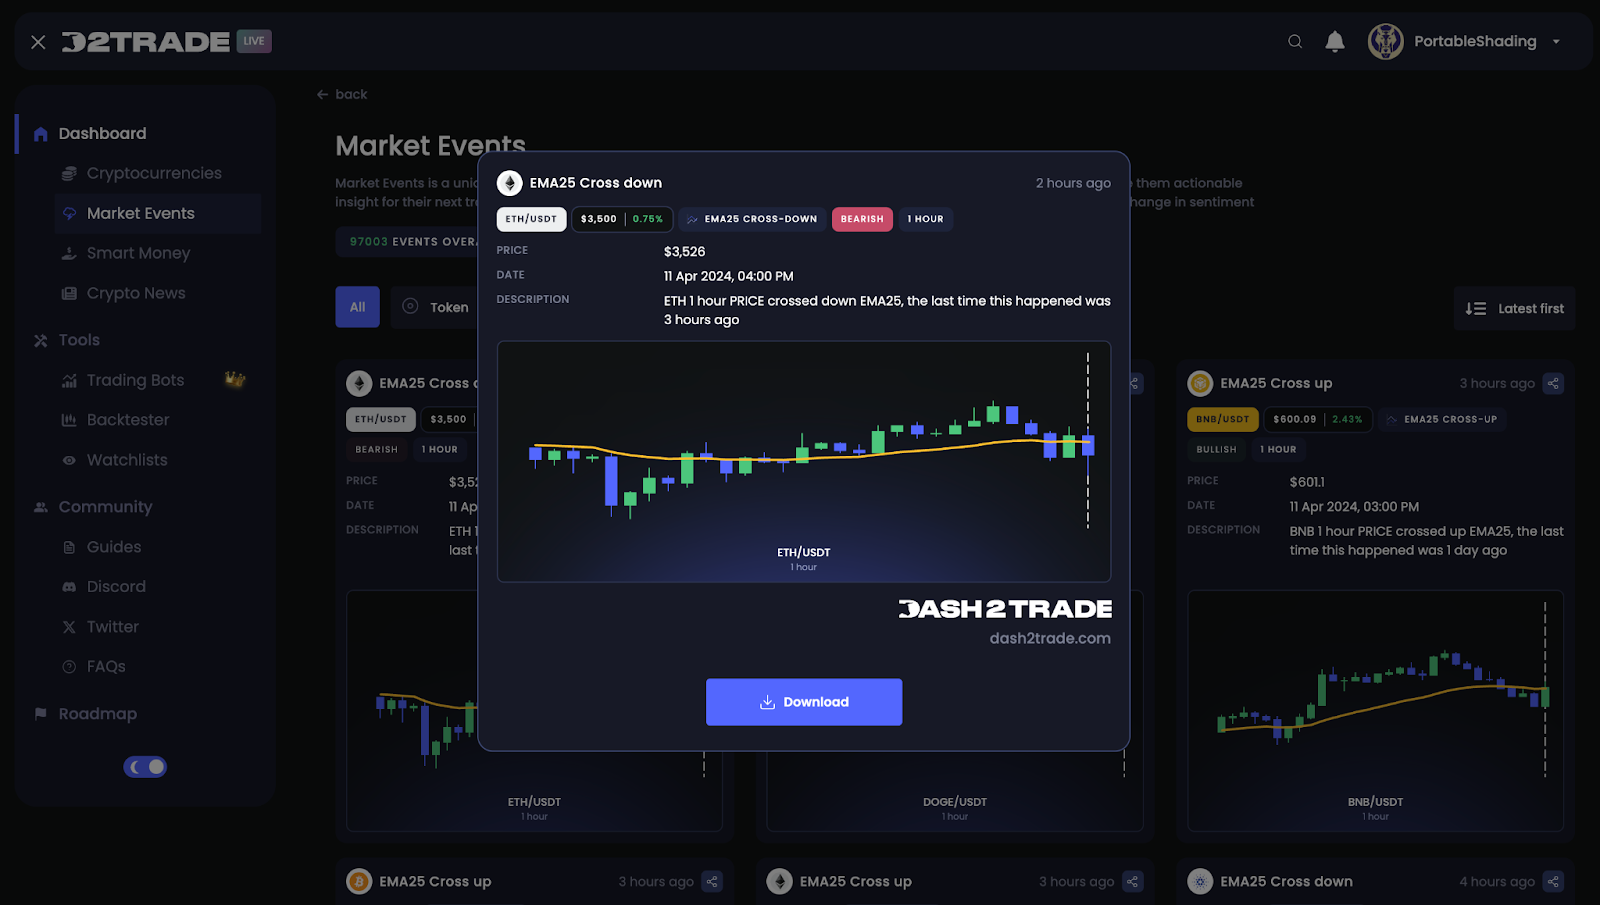
A market event features:
- The event’s name (e.g., EMA25 Cross Down, Price Increase, Oversold).
- A timestamp showing when the signal was discovered.
- The token trading pair the signal relates to.
- The token price.
- The selected timeframe.
- The price change over the selected timeframe.
- The event’s sentiment (either Bullish or Bearish).
- A description of the event
- A graphical representation of the indicator responsible for generating the signal.
There is also a “Share” button in the top right corner, where users can download the infographic to share on social media or for record-keeping purposes.
Price Increase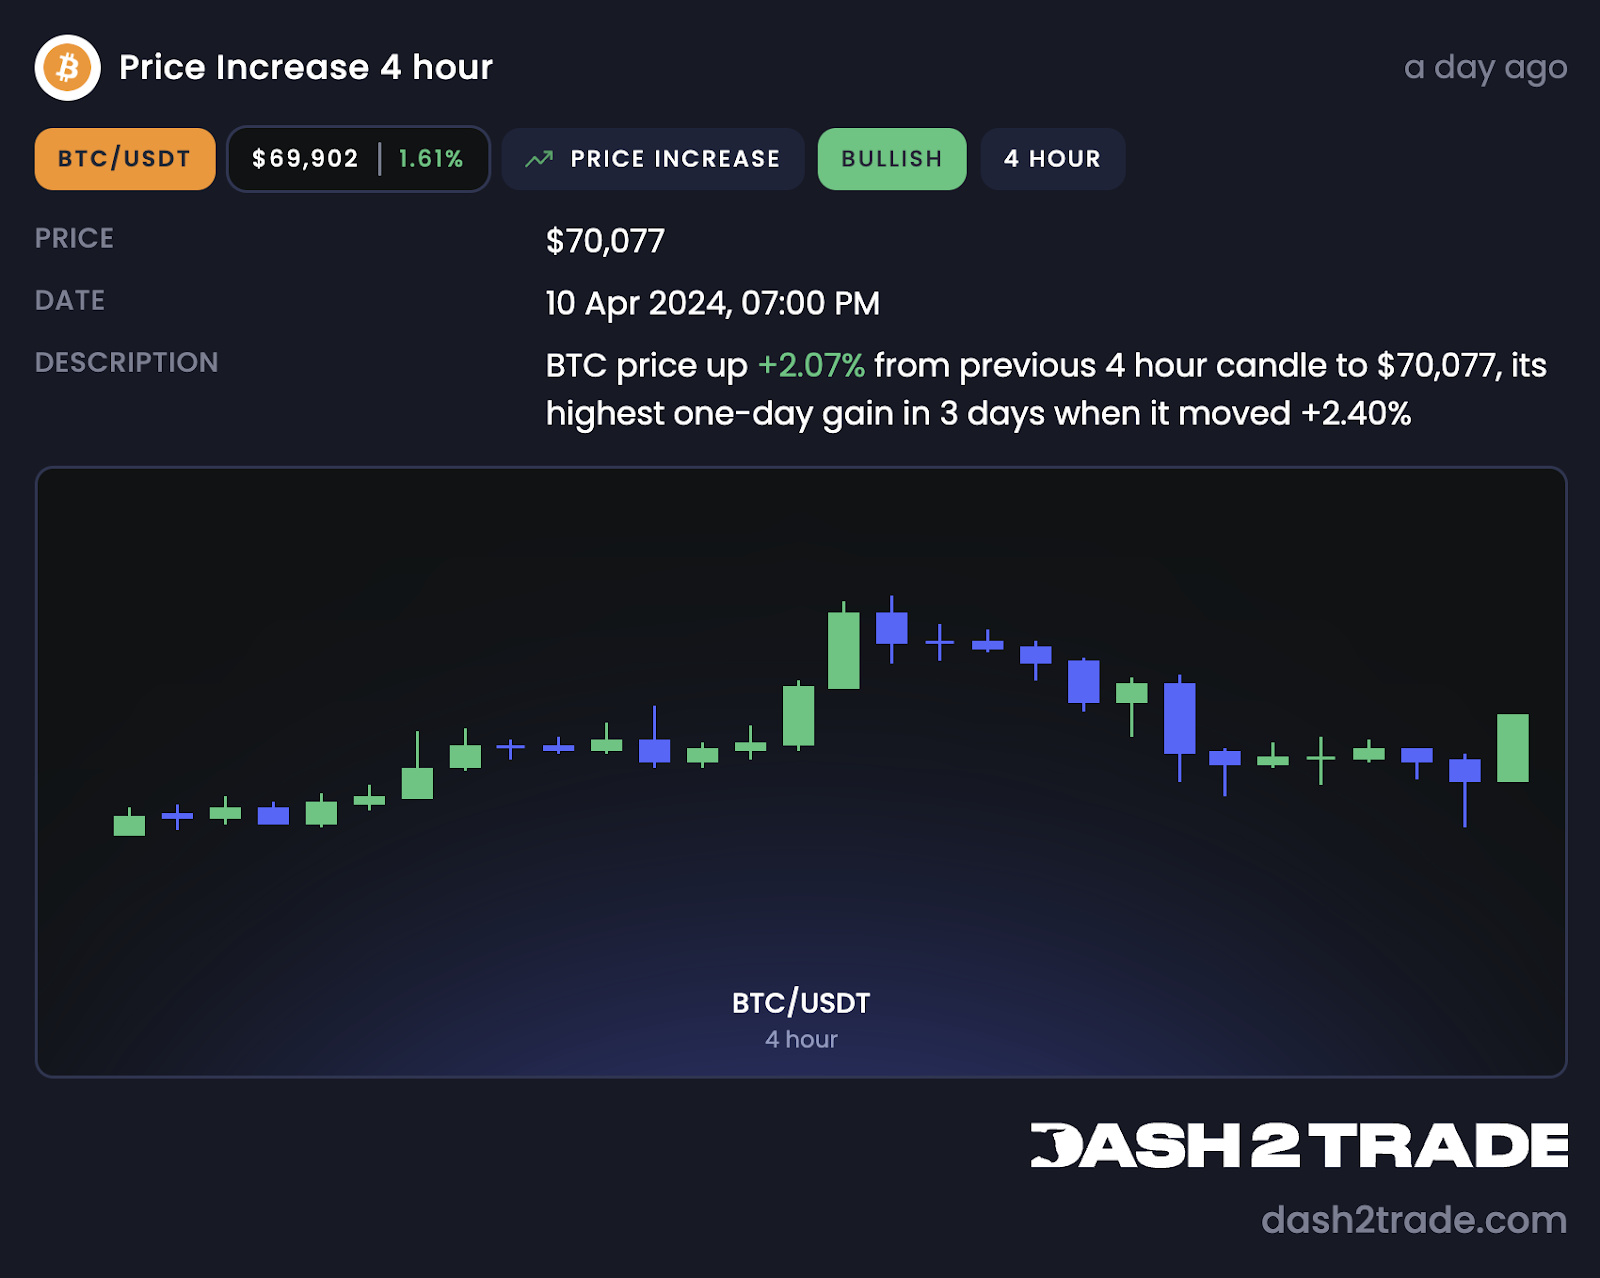
The Price Increase event signals a rapid positive change in the price of a token. It’s a bullish event that often comes when there’s a bullish price reversal or a breakout above some resistance level.
Price Decrease
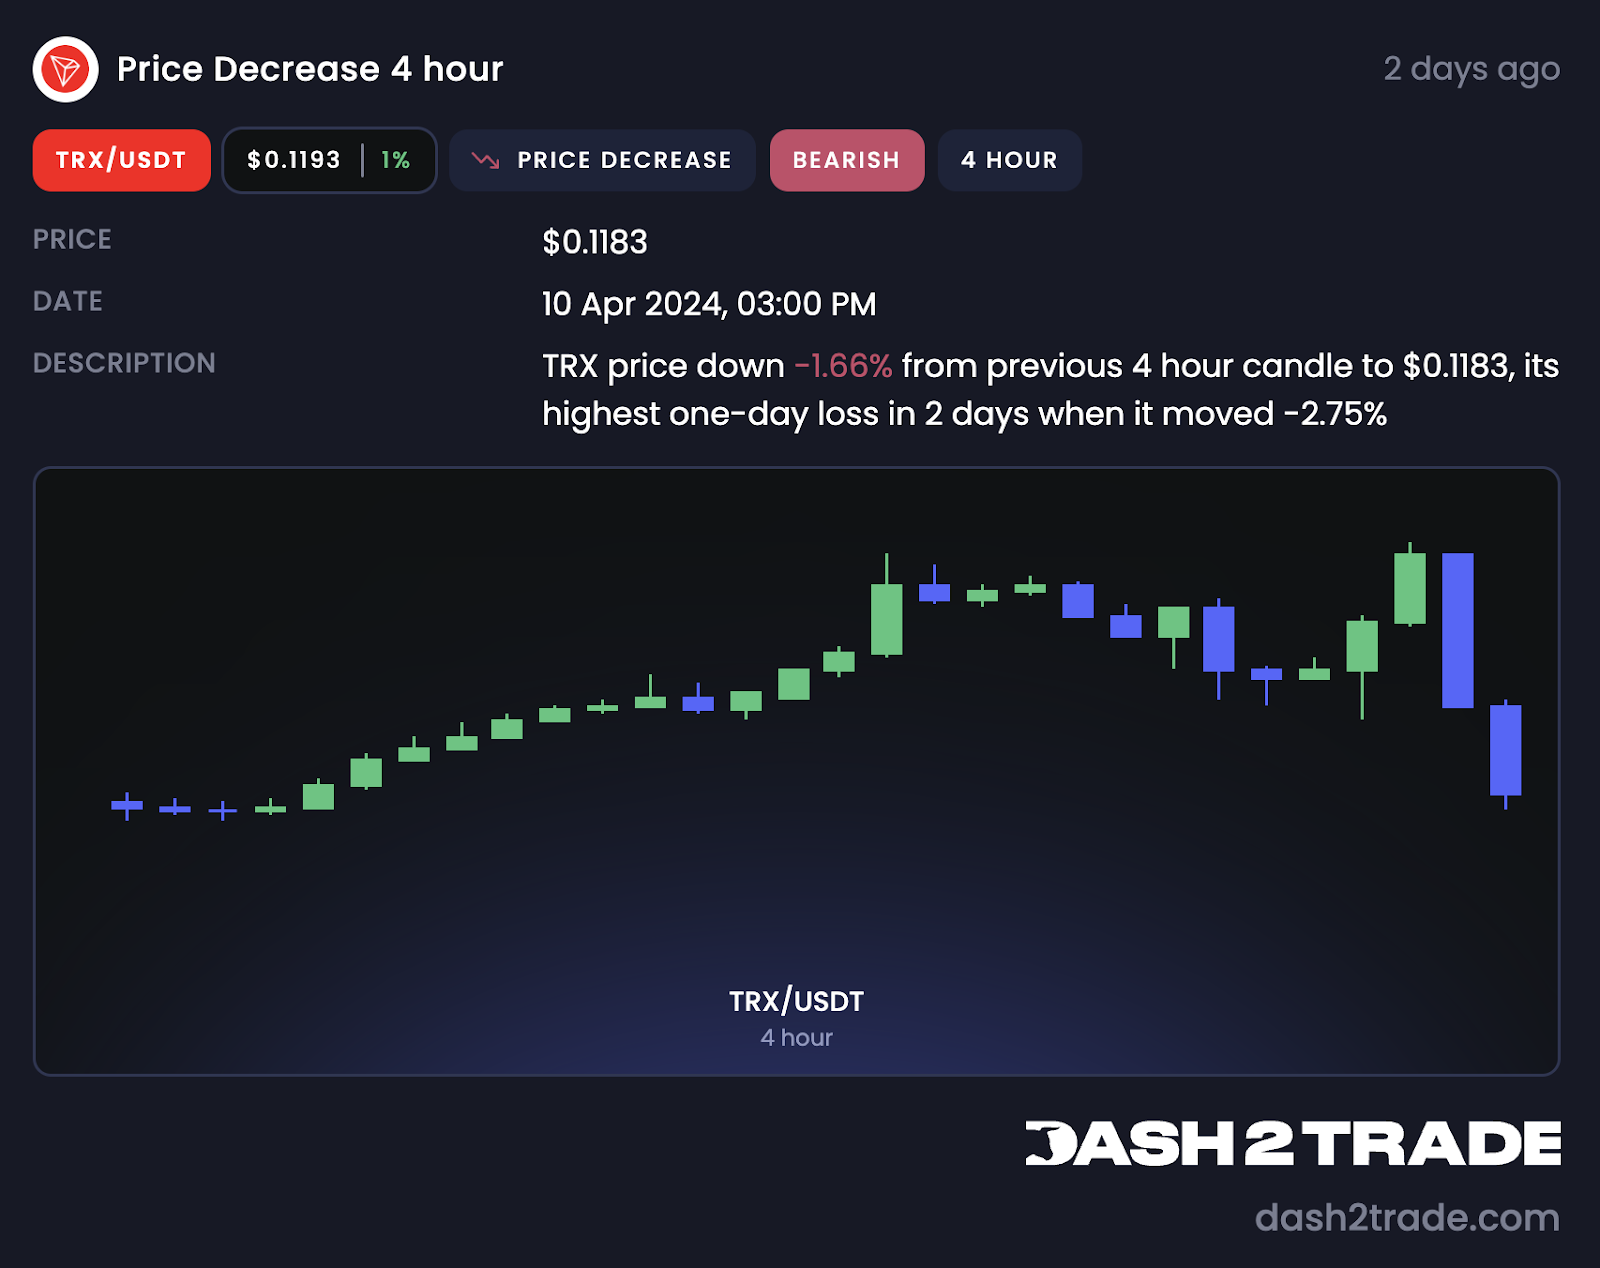
The Price Decrease event is a bearish event signaling a rapid decrease in price over a short period. It most often occurs when there’s been a failed breakout above a resistance level, when market momentum has been slowing for some time, and when there’s been some bearish news.
High Volume
High volume occurs when there’s either a strong upward or downward price trend and traders are piling on to open and close positions. Another common reason is that there’s a significant tug of war happening between bulls and bears and the market’s trying to find its new direction.
Taken on its own, High Volume is neither a bullish nor bearish event but observed with other events like Price Increase and Price Decrease it can indicate the presence of a strong new price trend.
The event info card will state whether the event is bullish or bearish based on the price trajectory.
Low Volume
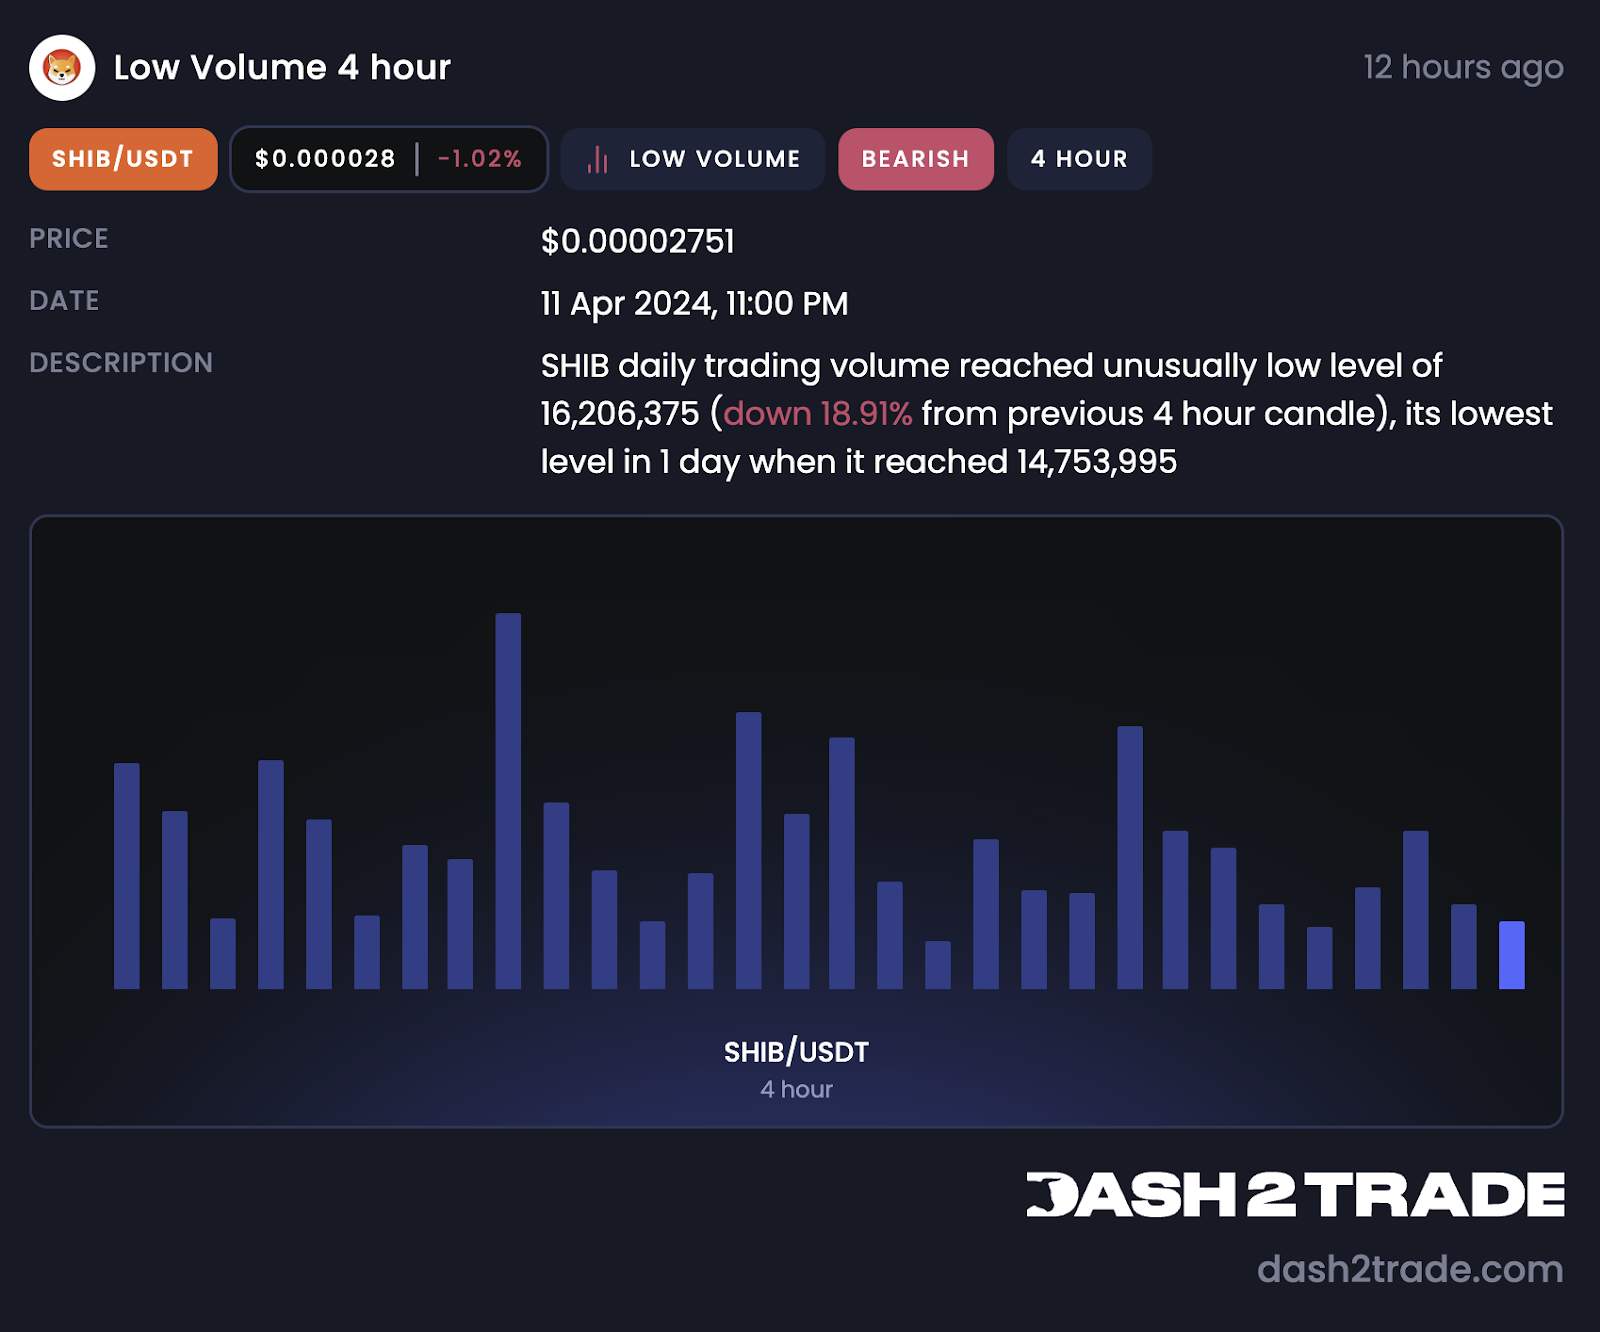
Low Volume market events typically happen when there’s a lack of a strong trend in the market or when a trend is faltering. Low volume can most commonly be observed during ranging markets, where prices neither trend up nor down but are instead stuck in a range between strong resistance and support levels.
Just like High Volume, Low Volume events are neither bullish nor bearish. It all depends on the context and the event card itself will say whether this particular case is bullish or bearish based on the current price action.
Traders can use this event with caution as an indication that a downtrending price is about to experience a reversal due to a decrease in sell pressure. On the other hand, low volume can be used to dismiss a breakout above a level of resistance.
High Volatility
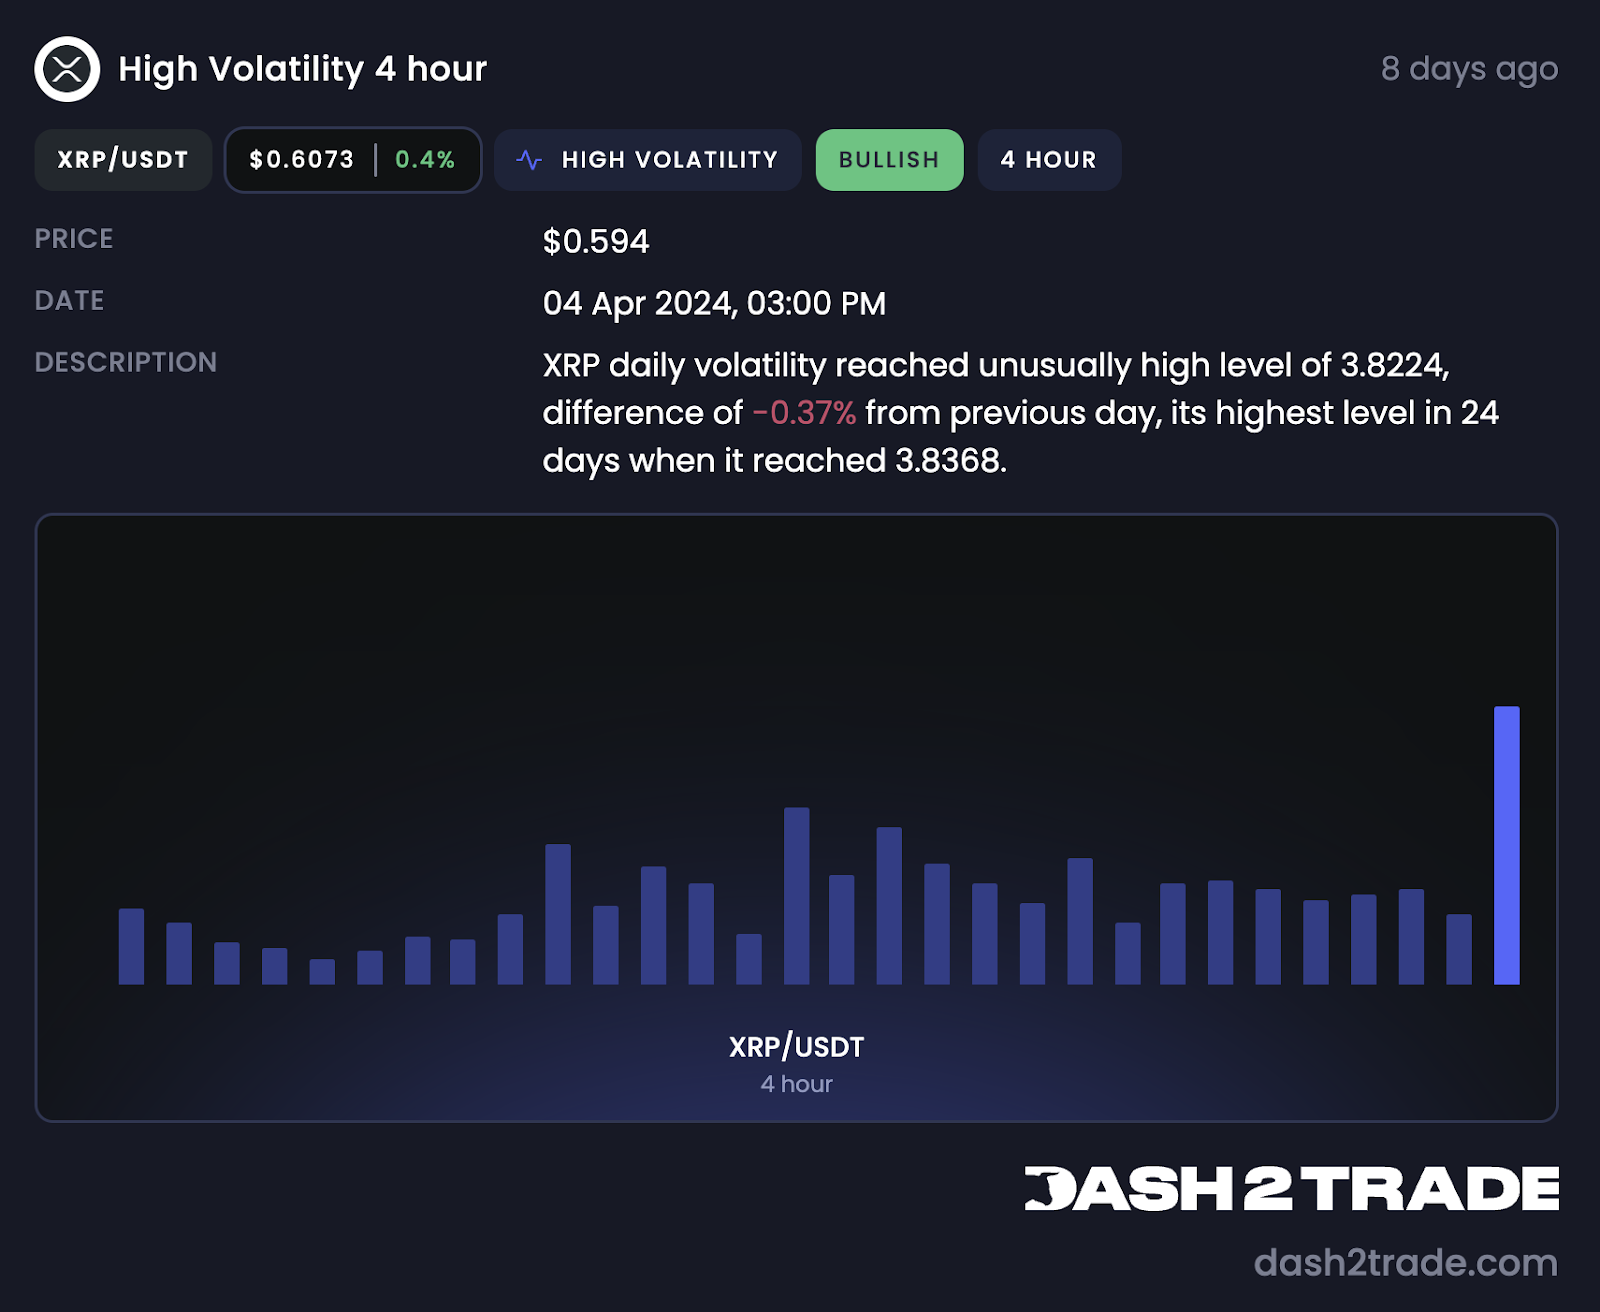
A slightly simplified explanation of volatility is that it’s a measure of the rate and amount of change in an asset's price. In other words how fast and by how much prices swing up and down.
The High Volatility event signals a substantial increase in volatility over a given period.
Market shakeups often lead to high volatility and an increase in volume. However, volatility can occur for various reasons, so it's important to analyze this event alongside other factors to determine a quality trading signal.
Low Volatility
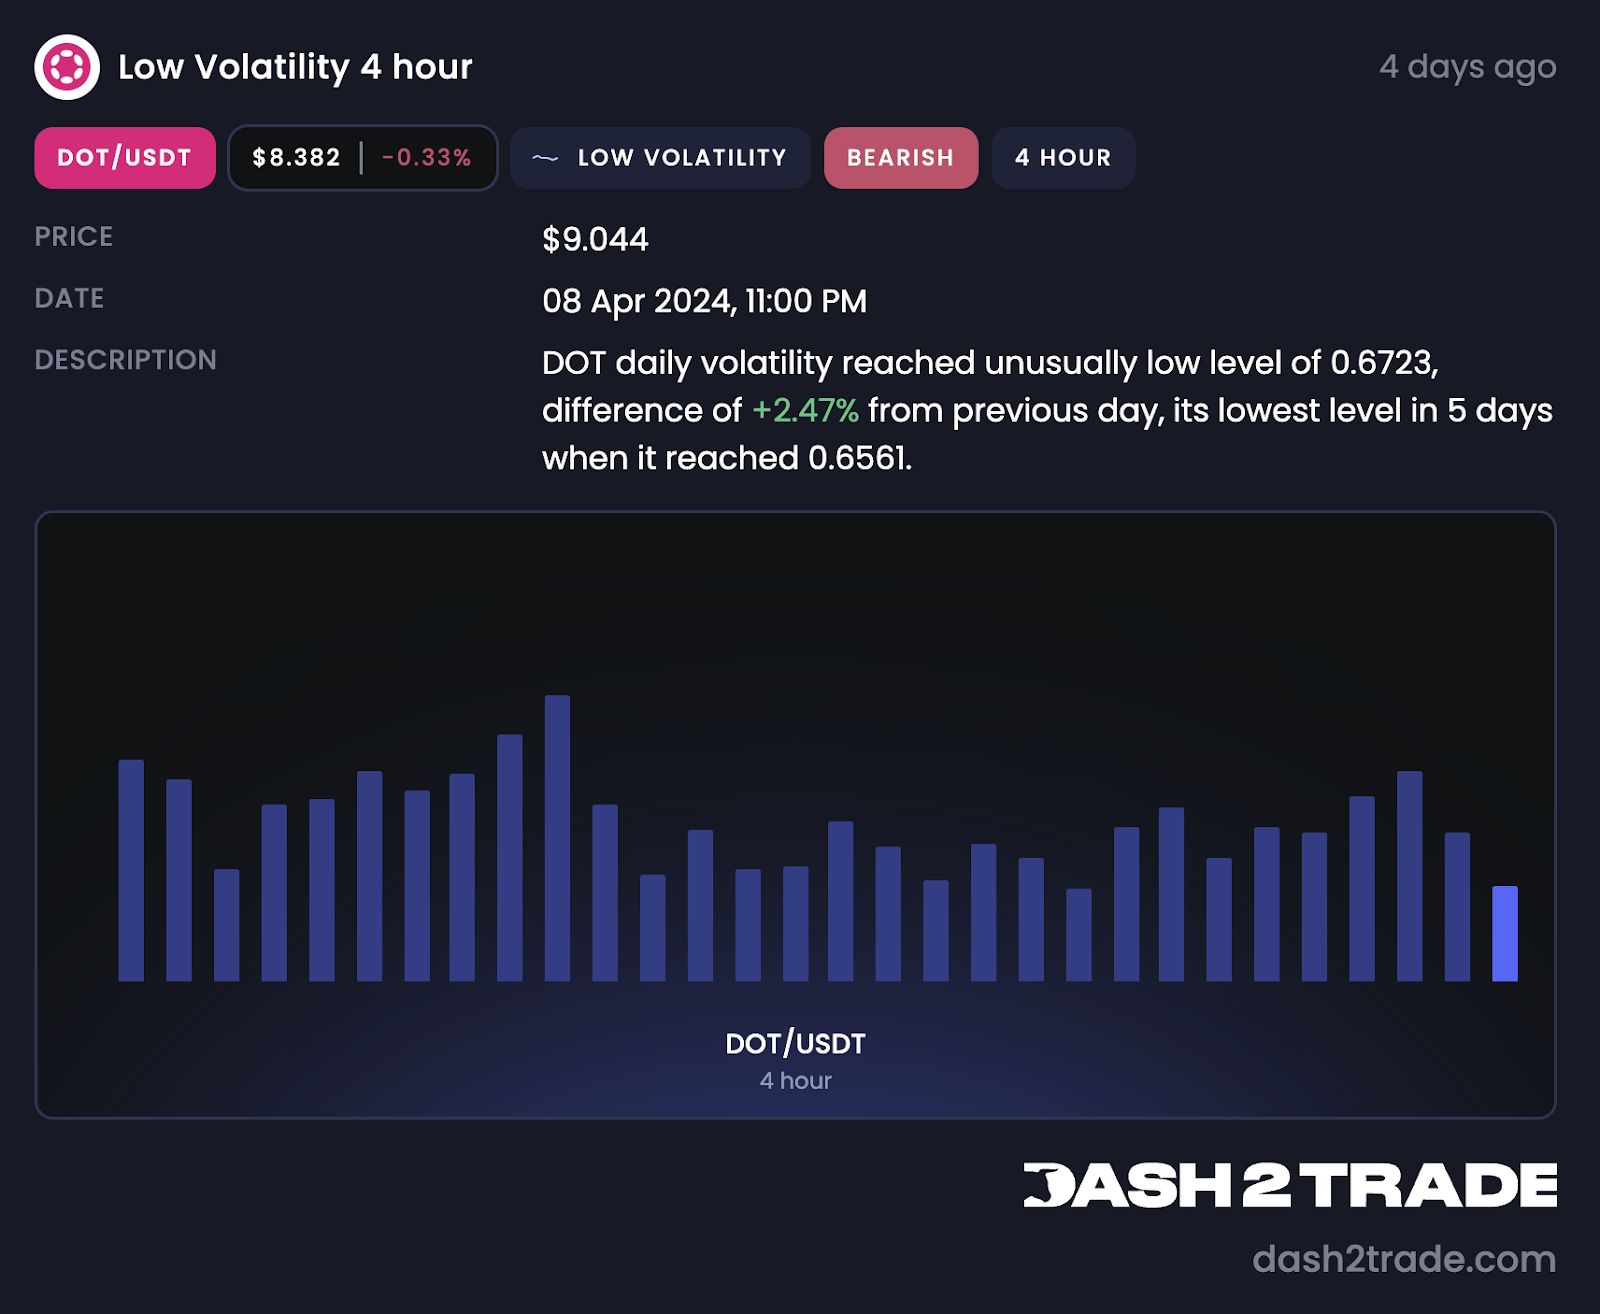
One situation when low volatility typically occurs is when market momentum has died down and both bulls and bears are more or less standing on the sidelines waiting to see which way the market will turn. Another common case is when a steady trend has formed and prices are moving along without much opposition in a particular direction.
The Low Volatility event can be an excellent signal to begin more closely observing a particular market. Usually, nothing major happens while volatility is low. Nothing is permanent in the markets, however, and a change in volatility is likely soon to occur.
The event is neither bullish nor bearish on its own.
Pump
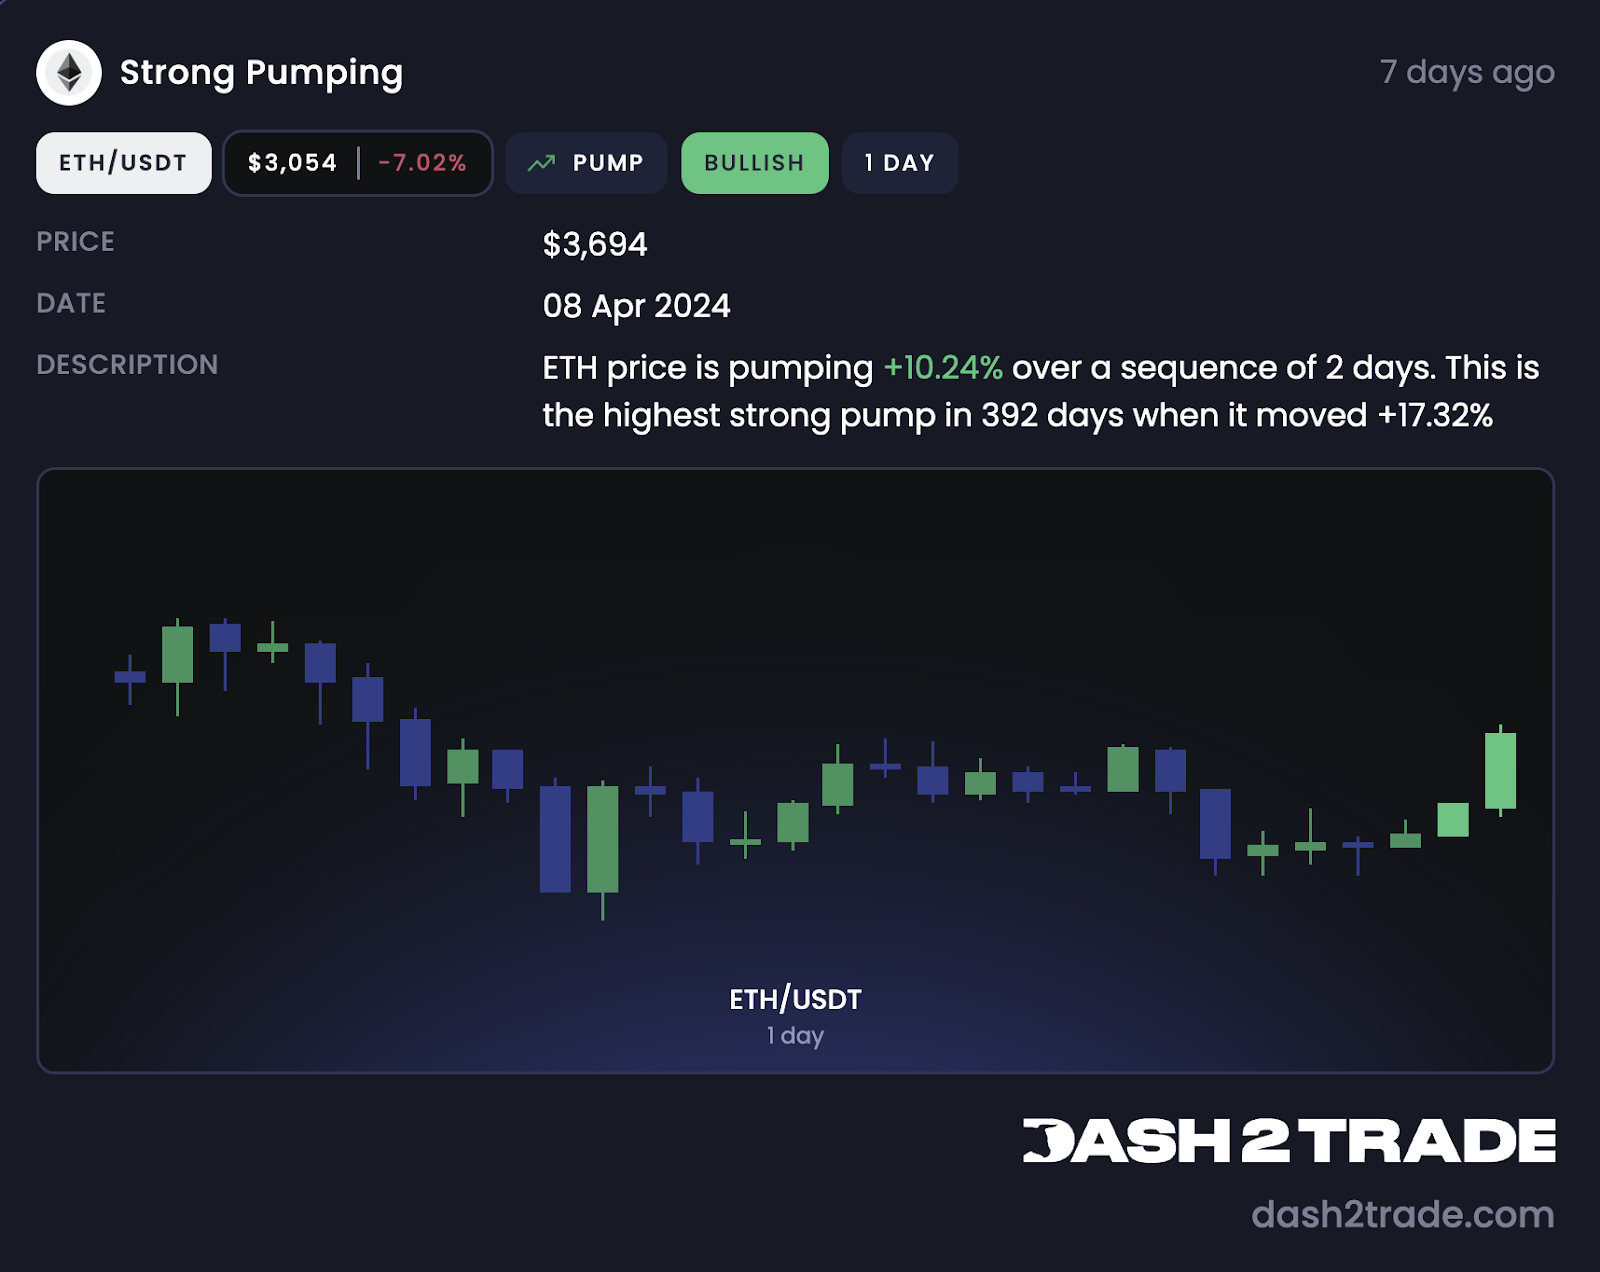
We say prices pump when they experience a sustained upward trend over multiple periods (candles).
The Pump event is bullish and gives a strong indication that there’s strong market interest for an asset.
Pump can be used together with the High Volume event to provide a strong “Buy” signal.
Dump
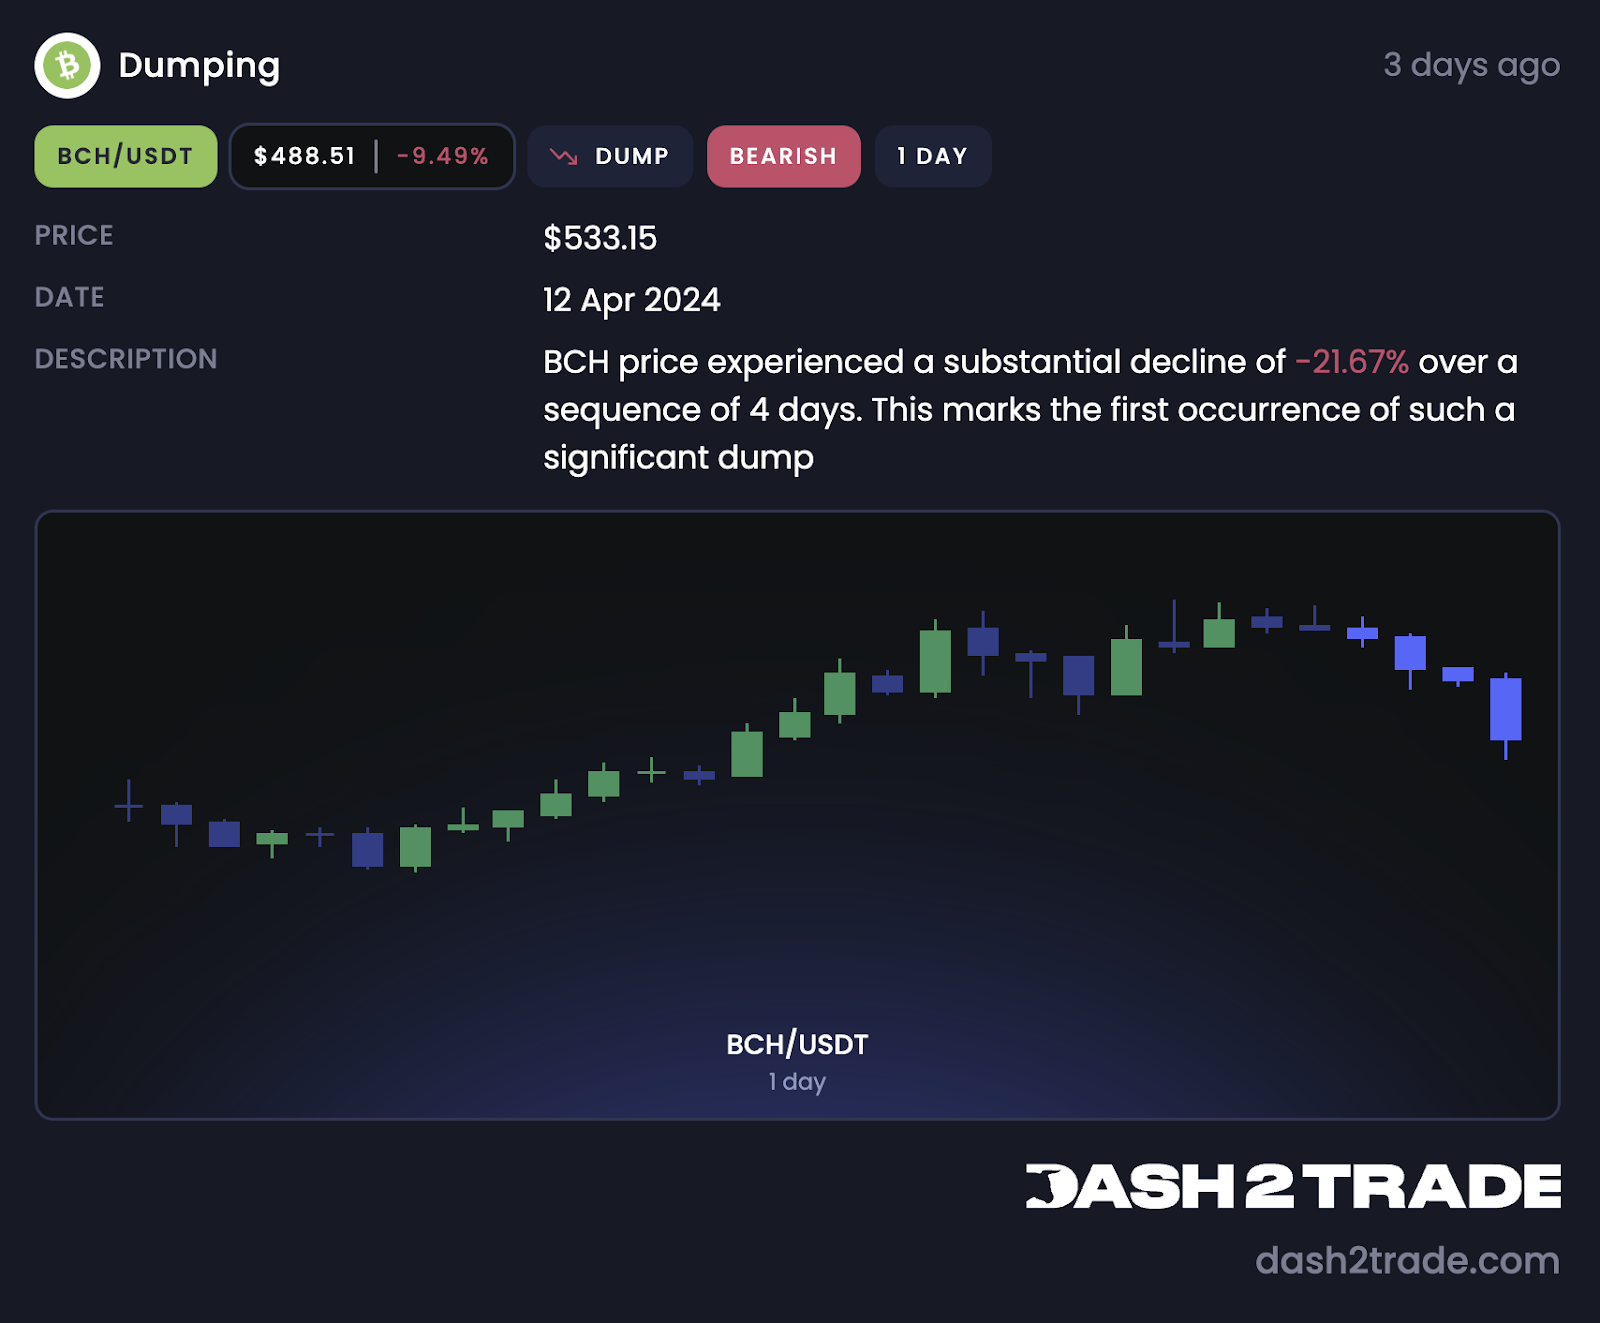
We say prices “dump” when there’s a sustained downward price trend that can be observed over multiple periods (candles).
The Dump event is bearish and can produce a strong sell signal when paired with the High Volume event. Conversely, if there’s a dump but the volume is low, a reversal may be coming.
Oversold
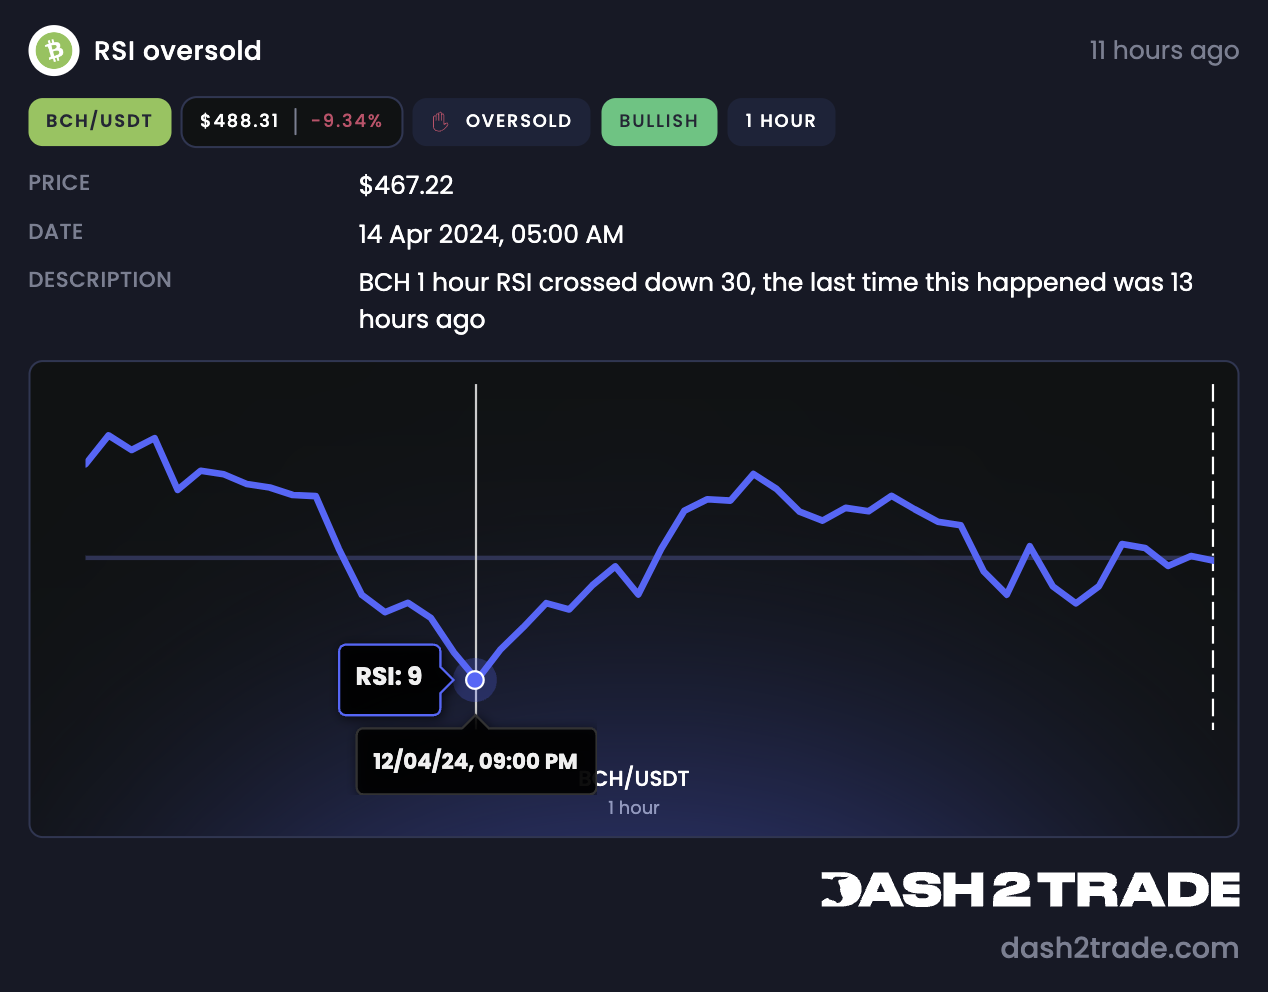
The Relative Strength Index (RSI) is a popular indicator traders use to judge oversold and overbought market conditions.
An RSI below 30 is considered oversold, meaning that statistically too much of an asset has been sold too rapidly and a change in price direction may soon come. Generally, this is known to be a bullish indication.
Take note of the occurrence of both High and Low Volume events and Oversold events. When a Low Volume event is observed during outlier RSI indications, it is an indication that a change in the price direction is impending. However, if the Volume is High, it could mean that the directional move is not yet complete.
Overbought
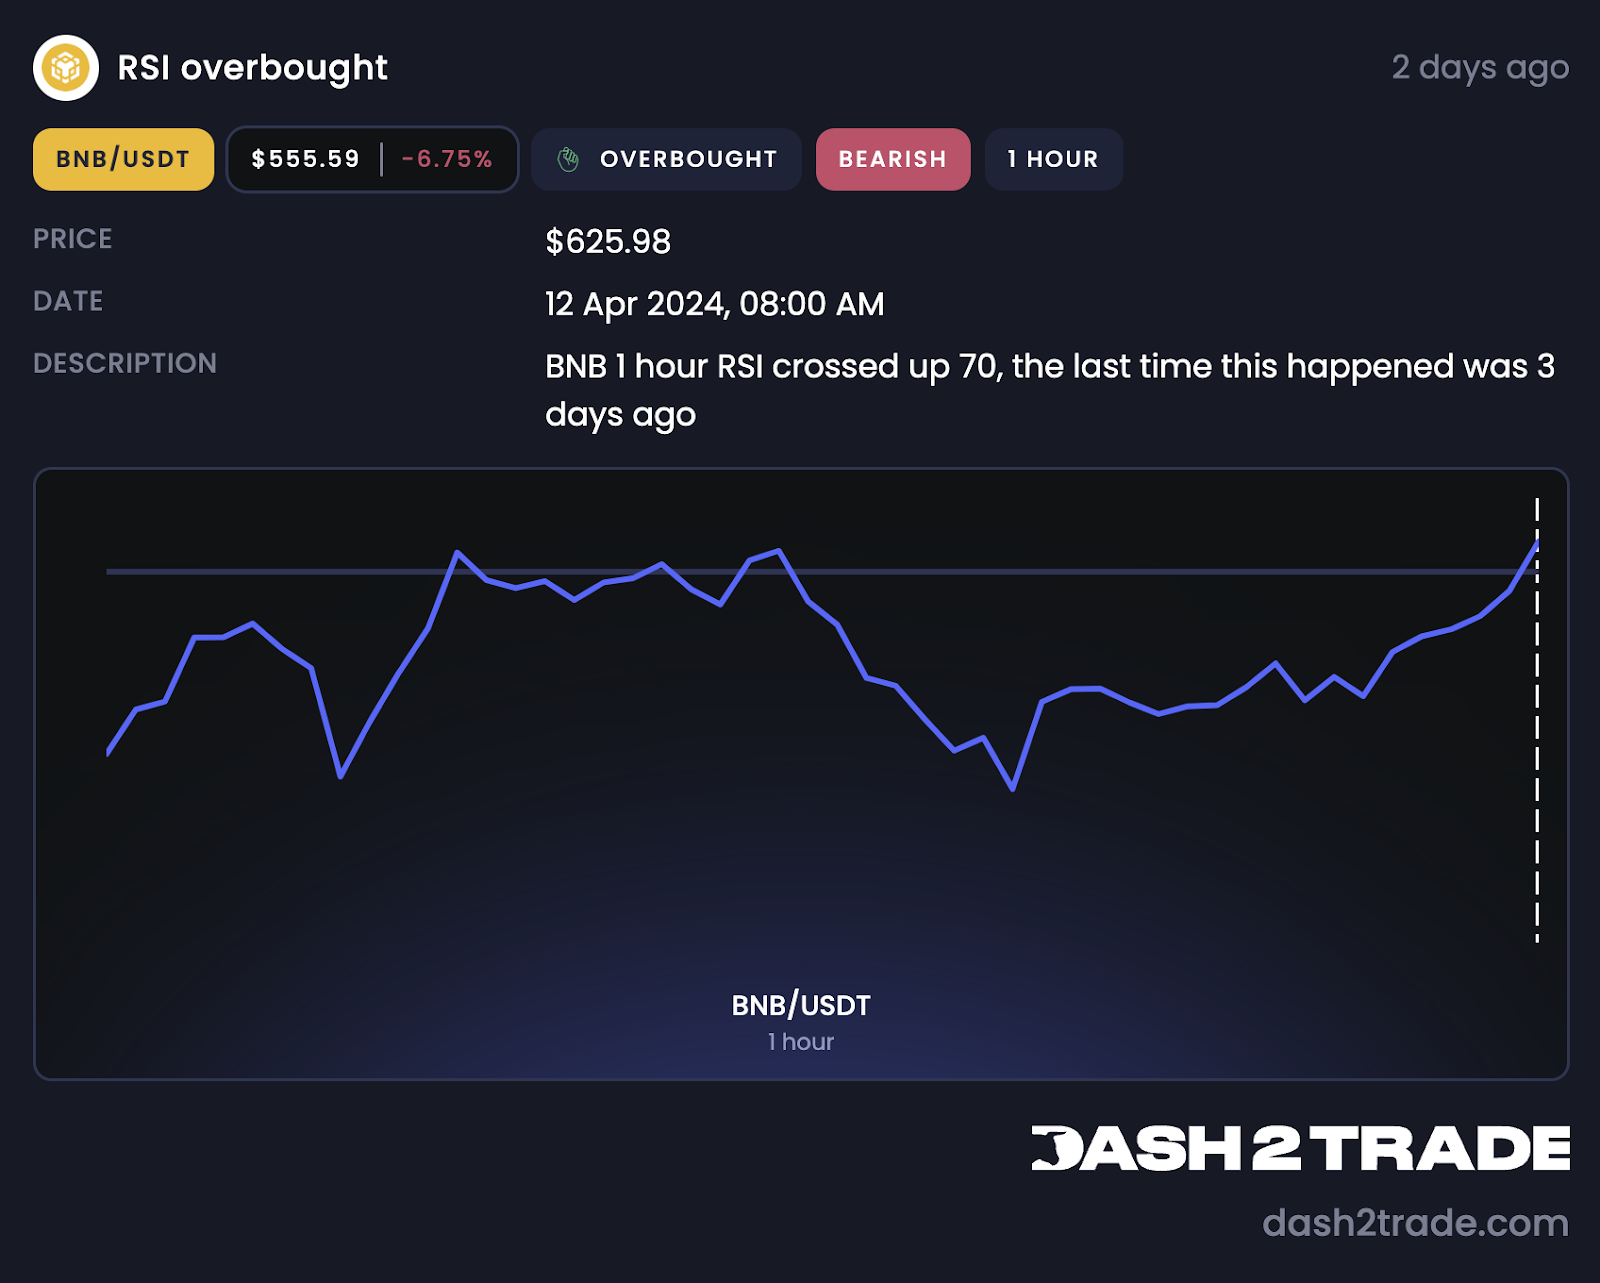
When RSI crosses above 70 markets enter into overbought territory.
The Overbought indicator is bearish and just like the Oversold event needs to be considered in conjunction with Volume events for better accuracy.
EMA 200 Cross-UP/Cross-Down

The Exponential Moving Average (EMA) is an indicator that tracks the average price of an asset over a defined period of time while giving more significance to more recent prices.
The EMA 200 tracks the recent-price-weighted average of the last two hundred periods (candles).
The EMA 200 Cross-Up is a market event where the current market price crosses above the EMA. This is a bullish event and means that the price is now trending above the average price for the last two hundred periods.
Conversely, the Cross-Down event indicates that the price has crossed below the 200-period average, which is considered bearish.
EMA 25 Cross-UP/Cross-Down
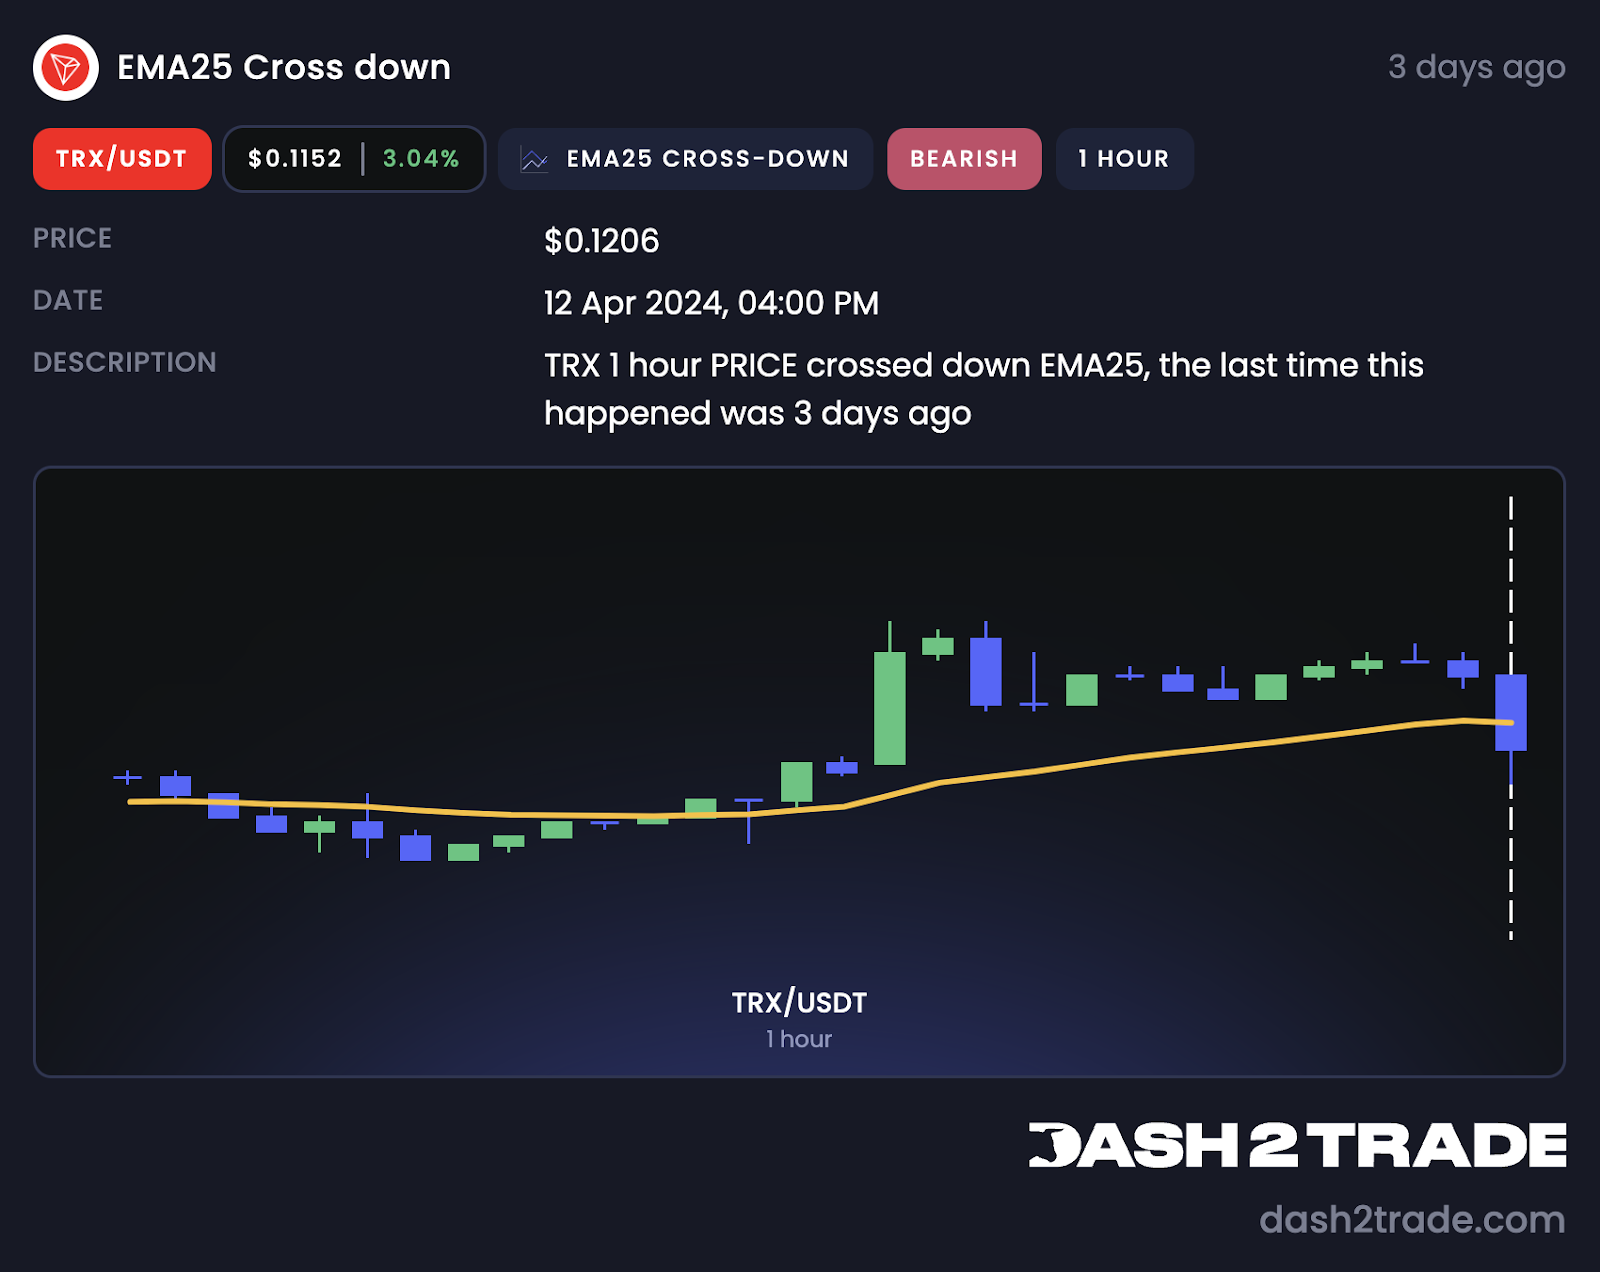
Just like with the EMA 200, the EMA 25 Cross-Up and Cross-Down events track the relationship between the price and the moving average to provide trading signals. In this case, the only difference is that the time period is much shorter — twenty-five periods (candles).
Golden Cross
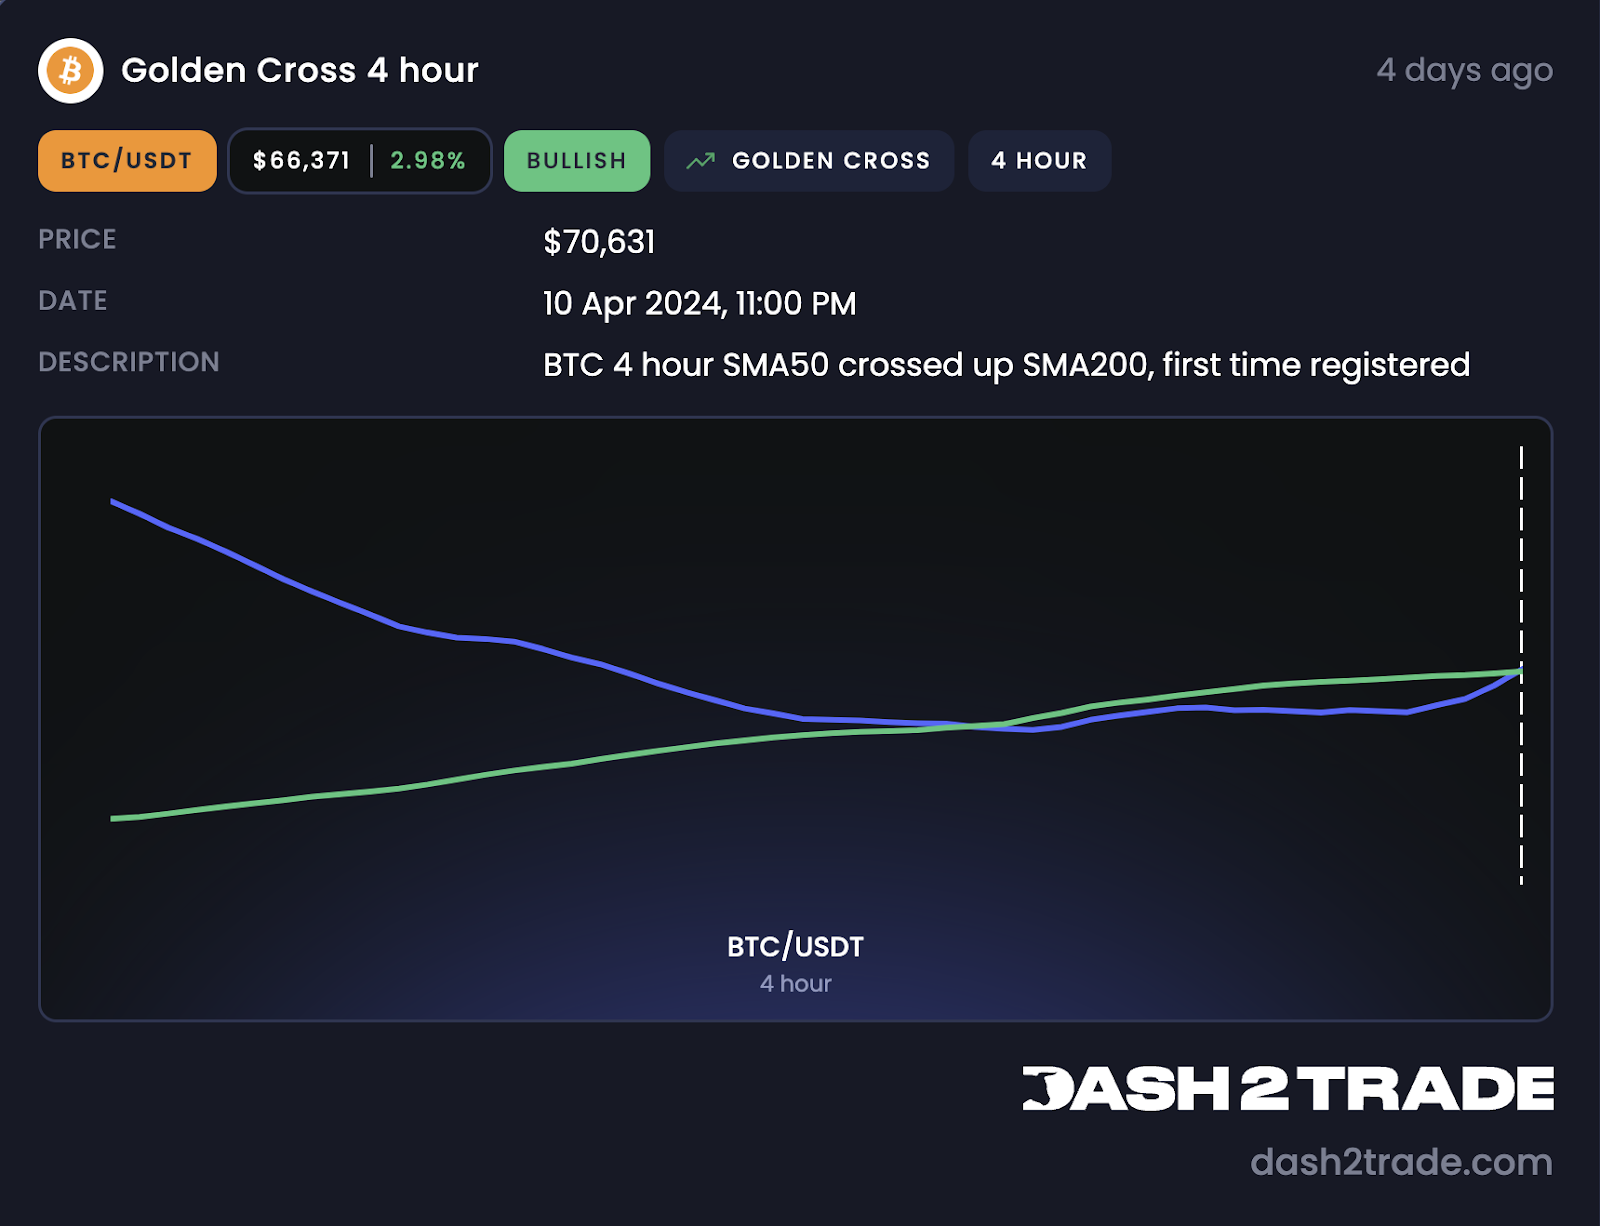
A Golden Cross event is often regarded as an extremely bullish signal in the crypto trading world.
It occurs when a shoulder Simple Moving Average (SMA) like the fifty-period SMA (SMA 50) crosses above the two-hundred-period SMA (SMA 200).
Note: Here we’re using Simple Moving Averages (SMAs) not Exponential Moving Averages (EMAs) to create the event.
You can interpret the Golden Cross event as short-term price momentum outpacing long-term price momentum, which indicates an uptrend becoming even stronger.
Death Cross
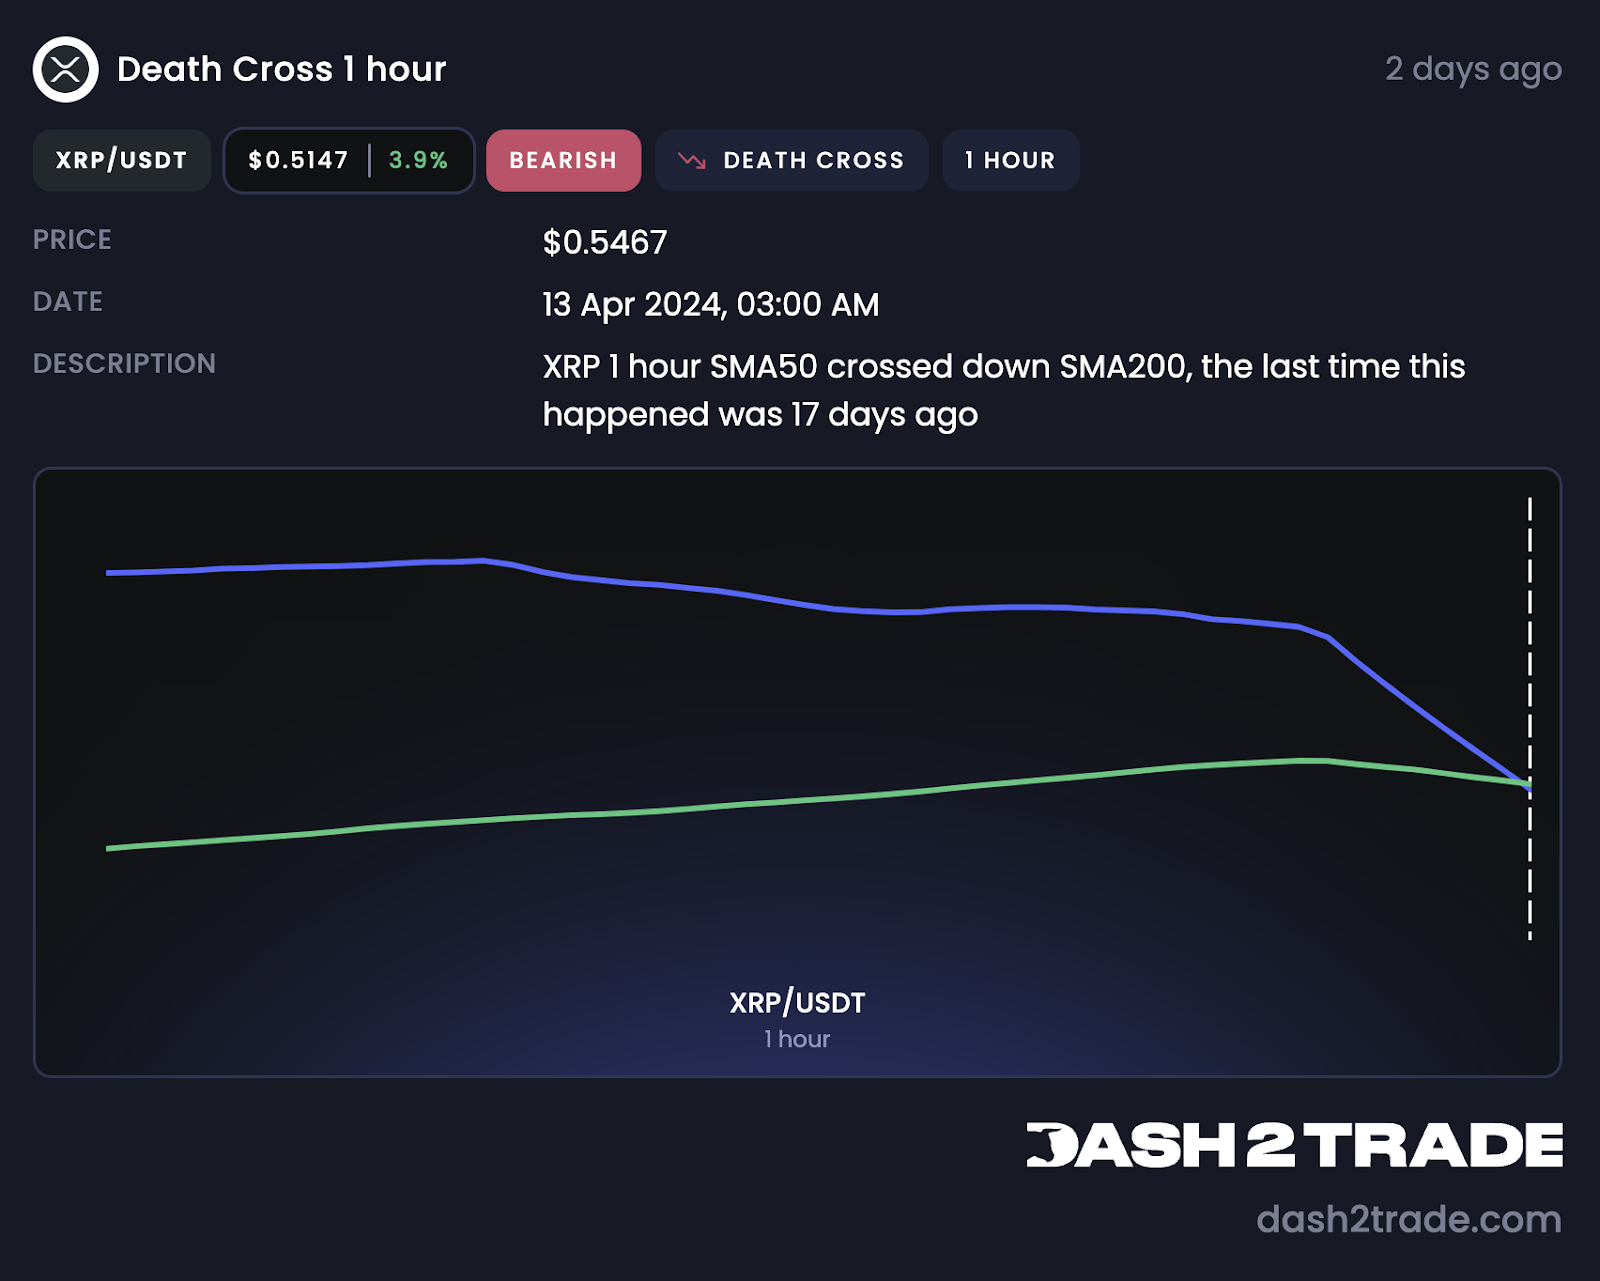
The Death Cross is the polar opposite of the Golden Cross. It’s bearish, signaling a steepening negative price trend that is outpacing the long-term rate of decline.
Because of the Death Cross’s popularity, it’s reasonable to expect elevated sell pressure when the event occurs that can push prices down further.
Dive Deep Into Crypto Trading Fundamentals on Our Academy
In addition to dozens of indispensable crypto trading tools, Dash 2 Trade also offers detailed yet easy-to-follow educational content, created to get you up to speed on everything there is to know about crypto trading.
Explore the diverse collection of crypto guides and articles on the Dash 2 Trade Academy!
Join Dash 2 Trade and Get all the Percs of Pro Crypto Trading!
As we've explored today, understanding market signals through technical analysis is essential for every savvy crypto trader. Dash 2 Trade's Market Events page is your go-to resource for real-time trading signals across numerous cryptocurrency pairs. It provides an invaluable eagle-eye view of the market, allowing you to make informed trading decisions with confidence.
Don't stop here! Enhance your trading strategies with D2T's state-of-the-art, crypto bundles, crypto bots, and backtesting tools. These tools are designed to automate and test your trading strategies, giving you a competitive edge in the dynamic crypto market.
Finally, don’t forget to join our Discord to meet like-minded traders, discuss market alpha, and get the latest news and updates on Dash 2 Trade!